System Components
This section details the key components and algorithms that constitute the GeneInsight system.
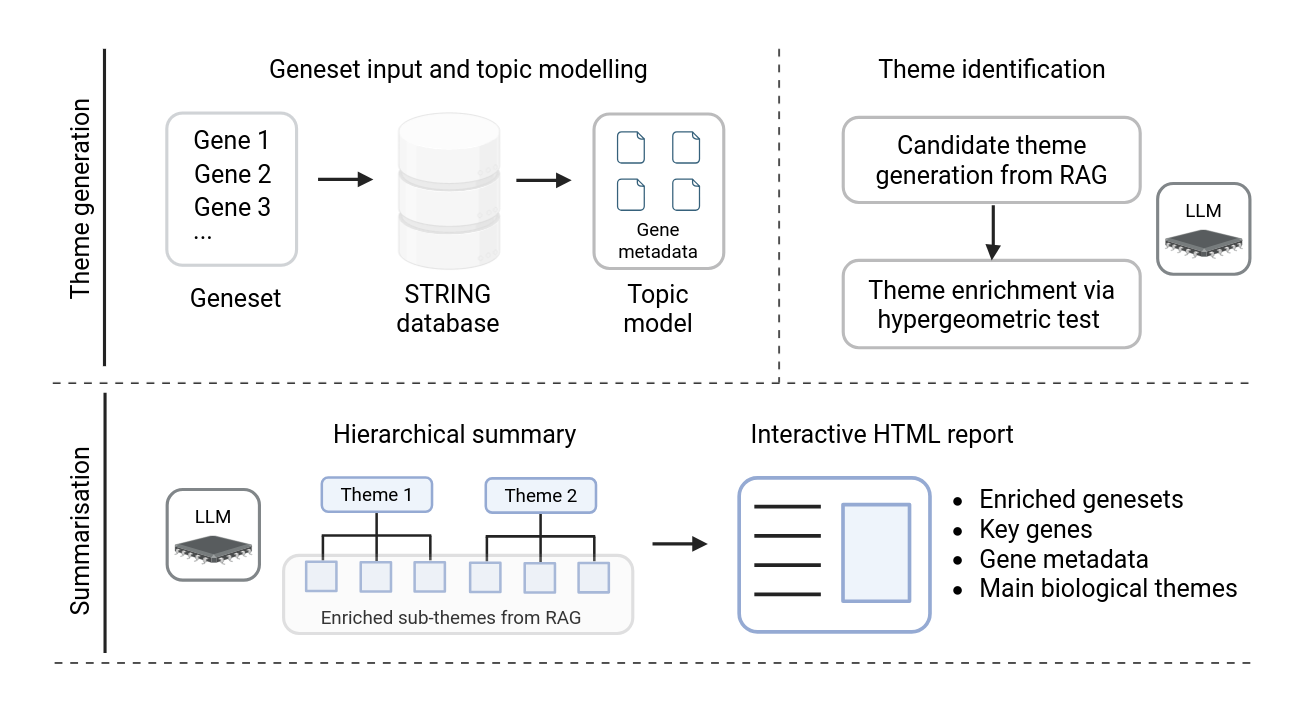
Figure 1: GeneInsight workflow framework showing the two main phases: Theme Generation (top) and Summarisation (bottom). Theme Generation processes gene sets through STRING database and topic modeling before identifying themes via hypergeometric testing. Summarisation organizes themes hierarchically and produces an interactive HTML report.
Data Sources
STRING Database
The STRING database serves as a fundamental data source for GeneInsight, providing comprehensive protein-protein interaction (PPI) data across multiple organisms. GeneInsight utilizes STRING version 12.0, which integrates:
Direct physical interactions
Indirect functional associations
Experimental data
Pathway knowledge
Co-expression patterns
Text mining of scientific literature
For the analysis pipeline, GeneInsight leverages STRING’s functional enrichment API, which provides statistically validated functional annotations for protein sets. Each returned term is accompanied by:
False discovery rate (FDR)
p-value
Number of proteins mapped to that term
Core Algorithms
Semantic Embedding
GeneInsight generates dense vector representations of biological terms using the SentenceTransformer framework with the paraphrase-MiniLM-L6-v2 model. This produces 384-dimensional embeddings that capture contextual relationships between terms.
The embedding process enables:
Measuring semantic similarity between terms
Identifying conceptually related annotations
Clustering similar biological concepts
Quantifying term diversity in enrichment results
BERTopic Topic Modeling
The implementation uses BERTopic (v0.15.0) with customized parameters for biological text:
Document Vectorization: Converting gene annotations to semantic vectors
Dimensionality Reduction: Using UMAP to create a lower-dimensional representation
Document Clustering: Applying HDBSCAN to identify coherent topics
Topic Representation: Extracting characteristic terms using c-TF-IDF
Hyperparameter optimization focuses on two critical aspects:
Biological theme identification parameters
Rank-based clustering iterations
Statistical Framework
GeneInsight employs several statistical methods for validation and evaluation:
Hypergeometric Testing: Validating the significance of biological themes
Benjamini-Hochberg Correction: Controlling false discovery rate in multiple comparisons
Clustering Quality Metrics: * Davies-Bouldin Index for measuring cluster separation * Calinski-Harabasz Score for evaluating clustering quality
Semantic Similarity Metrics: * Cosine similarity for comparing embedding vectors * Word Mover’s Distance for orthogonal validation * TopK recall for evaluating theme preservation
Language Model Integration
GeneInsight interfaces with modern language models to enhance biological interpretation:
API Services
The system supports multiple API services:
OpenAI API: Default option that works with models like gpt-4o-mini
Ollama API: Local option for running models on your own hardware
Prompt Engineering
GeneInsight’s prompting strategy includes:
Context Provision: Including relevant background on biological concepts
Task Specification: Clear instructions for theme interpretation
Output Formatting: Guidelines for creating consistent, structured responses
Few-Shot Examples: Demonstration of desired output format and quality
Output Processing
After receiving API responses, GeneInsight:
Validates the structural integrity of the response
Extracts the thematic content and metadata
Integrates the interpreted themes with statistical results
Structures the information for the final report
Visualization Framework
The interactive HTML report is built using:
JavaScript: For interactive elements and dynamic content
D3.js: For data visualization components
Bootstrap: For responsive layout and styling
Key visualizations include:
Topic Map: 2D representation of theme relationships
Gene-Theme Network: Interactive graph showing connections
Heatmaps: Visualizing gene presence across themes
File System and Storage
GeneInsight organizes analysis outputs in a structured directory:
CSV files for detailed data export
Interactive HTML for visualization
Compressed archives for easy sharing of both the report and data
Full enrichment results and API call information in single CSV files for easy access