Output Format
GeneInsight produces a comprehensive set of output files containing the results of gene set analysis. This section describes the structure and content of these outputs.
Directory Structure
The output directory contains:
output/
├── index.html # Interactive HTML report
├── enrichment.csv # Gene enrichment data from StringDB
├── documents.csv # Document descriptions for topic modeling
├── topics.csv # Topic modeling results
├── prompts.csv # Generated prompts for API
├── api_results.csv # Results from API calls
├── summary.csv # Summary of topic modeling and enrichment
├── enriched.csv # Hypergeometric enrichment results
├── filtered.csv # Final filtered topics
├── metadata.csv # Run information and parameters
└── geneinsight_results.zip # All results in compressed format
File Descriptions
enrichment.csv
Contains gene enrichment data retrieved from the STRING database:
Gene identifiers
Associated terms and descriptions
Statistical significance measures
documents.csv
The corpus of gene-specific descriptions used for topic modeling:
Document IDs
Gene associations
Full text of annotations
topics.csv
Results from the topic modeling phase:
Topic IDs
Representative terms
Frequency and distribution information
prompts.csv
Generated prompts sent to the language model API:
Prompt IDs
Full text of prompts
Associated topics
api_results.csv
Responses received from the language model API:
Formatted biological theme descriptions
Metadata about API calls
Processing timestamps
summary.csv
Consolidated summary of topic modeling and enrichment results:
Theme IDs
Representative genes
Statistical metrics
enriched.csv
Results of hypergeometric enrichment analysis:
Theme identifiers
p-values and false discovery rates
Enrichment scores
filtered.csv
Final filtered topics based on statistical significance:
Selected theme IDs
Ranking information
Selection criteria
metadata.csv
Information about the analysis run:
Tool version
Run parameters
Execution timestamps
Interactive HTML Report
The index.html file provides a entry point to the html report which provides an interactive visualization of the analysis results.
Theme Pages
Dedicated pages for each identified theme featuring:
Theme descriptions generated by the language model
Associated genes with links to reference databases
Statistical significance metrics
Gene Set Visualizations
Heatmaps and network diagrams showing:
Gene presence across references
Relationships between genes and biological themes
Statistical enrichment patterns
Download Interface
Interactive interface to download:
Specific themes of interest
Associated gene sets
Customized subsets of results
Exploring the Results
After running GeneInsight, navigate to the output directory to find:
HTML Report: Open
index.htmlto view the interactive visualizationCSV Files: Explore detailed results in the various output files
ZIP Archive: A compressed version of all outputs for easy sharing
Understanding the Output
The HTML report includes:
Topic Map: A visual representation of identified biological themes
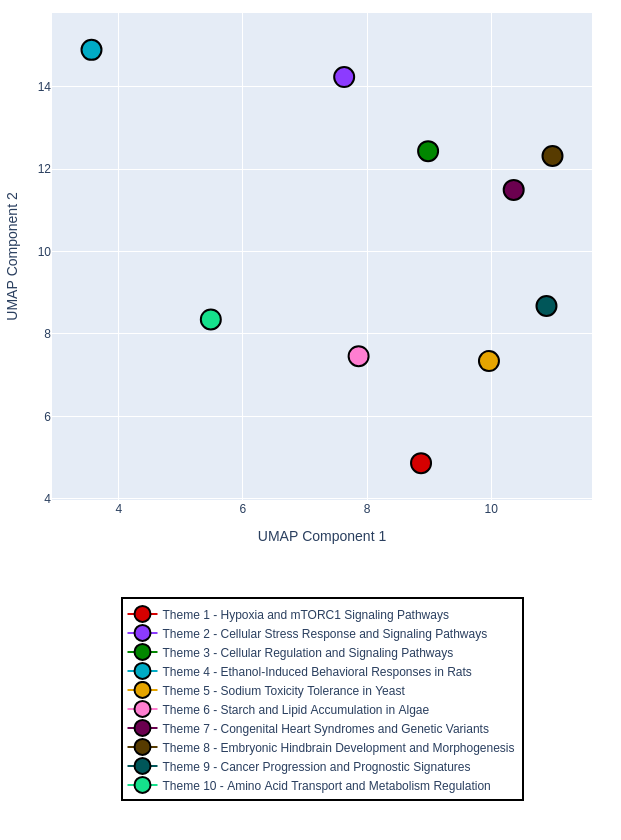
The topic map allows you to intuitively see larger groups of related biological themes without having to manually cross-reference multiple ontologies. Themes that appear close together in the visualization share biological meaning, functional relationships, or relevance to similar biological processes, even if they come from different ontology sources.
This visualization is particularly valuable for identifying unexpected relationships between biological themes that might not be apparent when examining individual ontology terms in isolation.
Gene Set Visualizations: Heatmaps showing gene presence across references
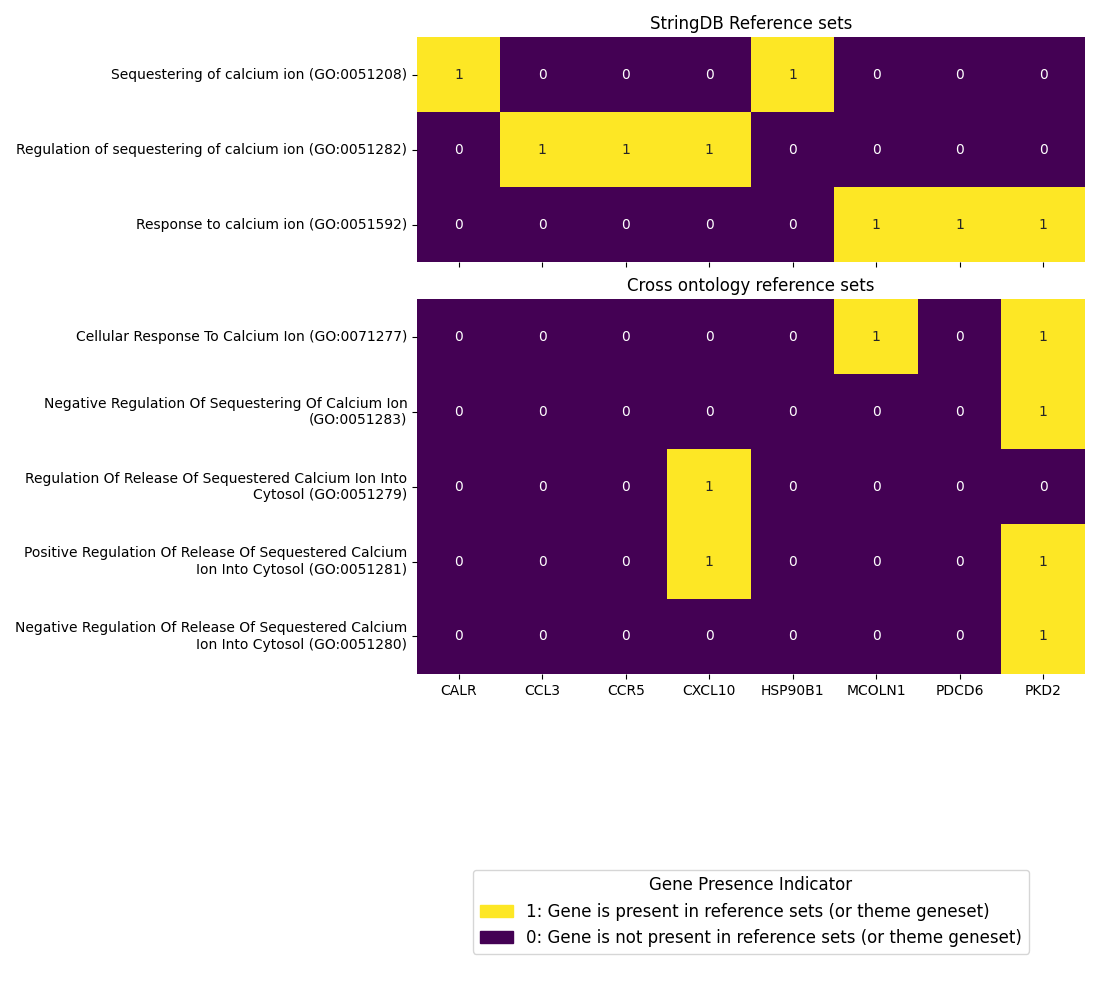
These heatmaps are particularly useful for:
Identifying which genes contribute most strongly to specific biological themes
Discovering how terms from commonly used ontologies (GO, HPO) relate to each other through shared gene associations
Finding unexpected gene-theme associations that might suggest novel biological functions
Prioritizing genes for experimental validation based on their prominence across multiple themes
The hierarchical clustering of both genes and themes helps reveal patterns that might not be obvious when examining individual gene-theme pairs, providing a systems-level view of the biological relationships in your data.
Theme Pages and Gene-Level Information: Detailed exploration of each identified theme
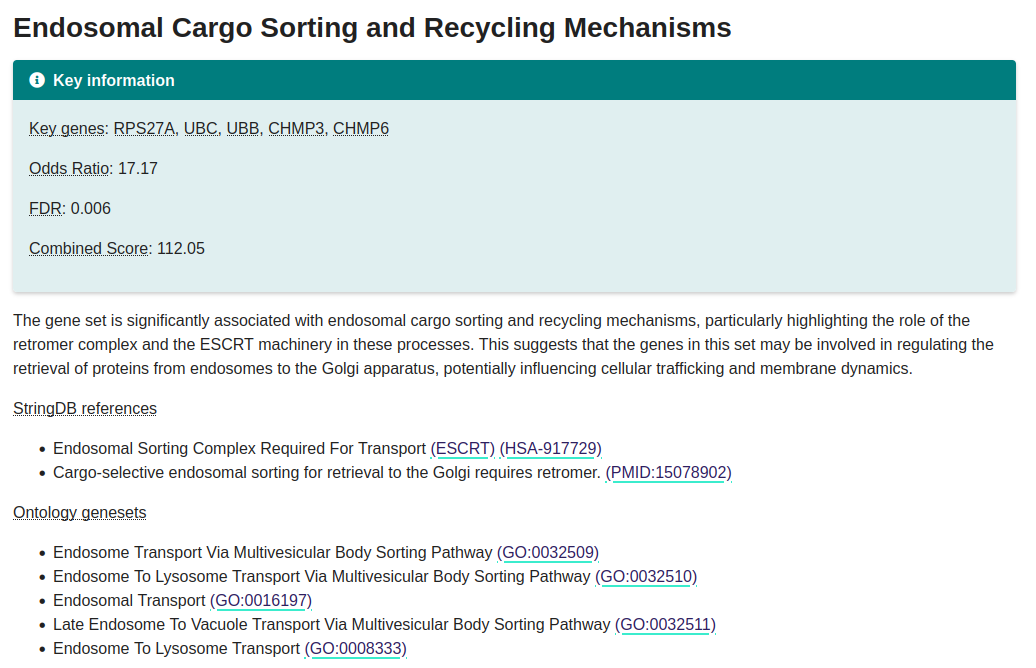
These detailed theme pages serve as comprehensive reference sheets for each biological theme identified in your analysis. They bring together information that would otherwise require searching across multiple databases and resources.
The theme pages consolidate:
Detailed enrichment information for each biological theme
STRING-DB annotations for associated genes
Ontology annotations across different systems (GO, HPO)
Additionally, the integration with NCBI’s API provides gene descriptions directly within the report. This consolidation of information allows researchers to quickly assess the biological relevance of each theme and its associated genes without having to manually search across multiple resources.
Practical Applications
This integrated report is designed to support several common research workflows:
Hypothesis Generation: Identify unexpected relationships between genes and biological processes that may suggest novel mechanisms
Candidate Prioritization: Rank genes for experimental validation based on their prominence across multiple biological themes
Pathway Analysis: Understand how genes of interest relate to established biological pathways and functions
Cross-Ontology Interpretation: Bridge the gap between different ontology frameworks (GO, HPO) through their shared gene associations
Data Integration: Combine your experimental findings with established knowledge from public databases